Find individual profiles on each of the 39 constituencies. The Oireachtas Library & Research Service has compiled these profiles using data from the Central Statistics Office (CSO) Census 2016 releases.
Constituency profiles from the L&RS
Sun, 9 Feb 2020
Carlow-Kilkenny – Constituency profile
Sun, 9 Feb 2020
Cavan-Monaghan – Constituency profile
Sun, 9 Feb 2020
Clare – Constituency profile
Sun, 9 Feb 2020
Cork East – Constituency profile
Sun, 9 Feb 2020
Cork North-Central – Constituency profile
Sun, 9 Feb 2020
Cork North-West – Constituency profile
Sun, 9 Feb 2020
Cork South-Central – Constituency profile
Sun, 9 Feb 2020
Cork South-West – Constituency profile
Sun, 9 Feb 2020
Donegal – Constituency profile
Sun, 9 Feb 2020
Dublin Bay North – Constituency profile
Sun, 9 Feb 2020
Dublin Bay South – Constituency profile
Sun, 9 Feb 2020
Dublin Central – Constituency profile
Sun, 9 Feb 2020
Dublin Fingal – Constituency profile
Sun, 9 Feb 2020
Dublin Mid-West – Constituency profile
Sun, 9 Feb 2020
Dublin North-West – Constituency profile
Sun, 9 Feb 2020
Dublin Rathdown – Constituency profile
Sun, 9 Feb 2020
Dublin South-Central – Constituency profile
Sun, 9 Feb 2020
Dublin South-West – Constituency profile
Sun, 9 Feb 2020
Dublin West – Constituency profile
Sun, 9 Feb 2020
Dún Laoghaire – Constituency profile
Sun, 9 Feb 2020
Galway East – Constituency profile
Sun, 9 Feb 2020
Galway West – Constituency profile
Sun, 9 Feb 2020
Kerry – Constituency profile
Sun, 9 Feb 2020
Kildare North – Constituency profile
Sun, 9 Feb 2020
Kildare South – Constituency profile
Sun, 9 Feb 2020
Laois-Offaly – Constituency profile
Sun, 9 Feb 2020
Limerick City – Constituency profile
Sun, 9 Feb 2020
Limerick County – Constituency profile
Sun, 9 Feb 2020
Longford-Westmeath – Constituency profile
Sun, 9 Feb 2020
Louth – Constituency profile
Sun, 9 Feb 2020
Mayo – Constituency profile
Sun, 9 Feb 2020
Meath East – Constituency profile
Sun, 9 Feb 2020
Meath West – Constituency profile
Sun, 9 Feb 2020
Roscommon-Galway – Constituency profile
Sun, 9 Feb 2020
Sligo-Leitrim – Constituency profile
Sun, 9 Feb 2020
Tipperary – Constituency profile
Sun, 9 Feb 2020
Waterford – Constituency profile
Sun, 9 Feb 2020
Wexford – Constituency profile
Sun, 9 Feb 2020
Wicklow – Constituency profile
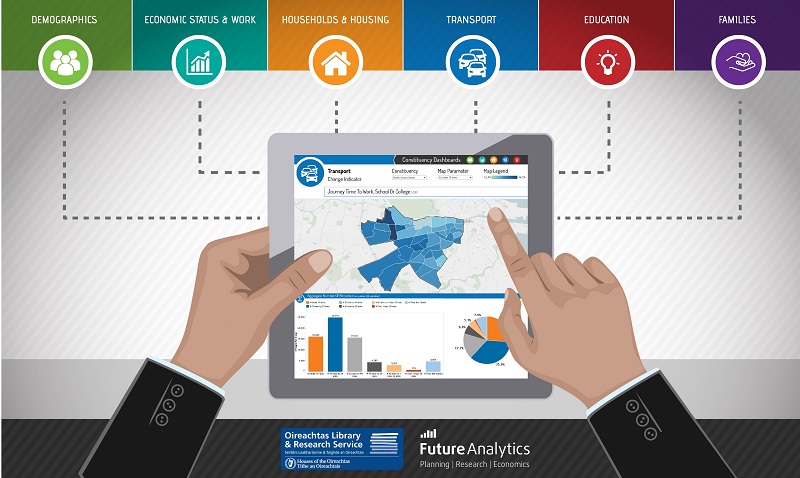
Constituency dashboards
Constituency dashboards provide an interactive online visualisation of Census 2016 data for each Dáil constituency. They are a great way to get the information you need about your constituency.